
Overview
What is it?
The new dashboards for Webgains Agency Users are designed to provide an overview of all programs within the Agency Portfolio. This allows our Agency partners to easily check their managed program’s health, key performance metrics, latest transaction counts, campaign membership requests, and more.
Who can access it?
The new dashboard is currently available for Webgains Agency users, to support with management of their portfolios.
They replace the previous dashboard view for Agencies. Advertiser users will currently have no change.
KPIs Explained
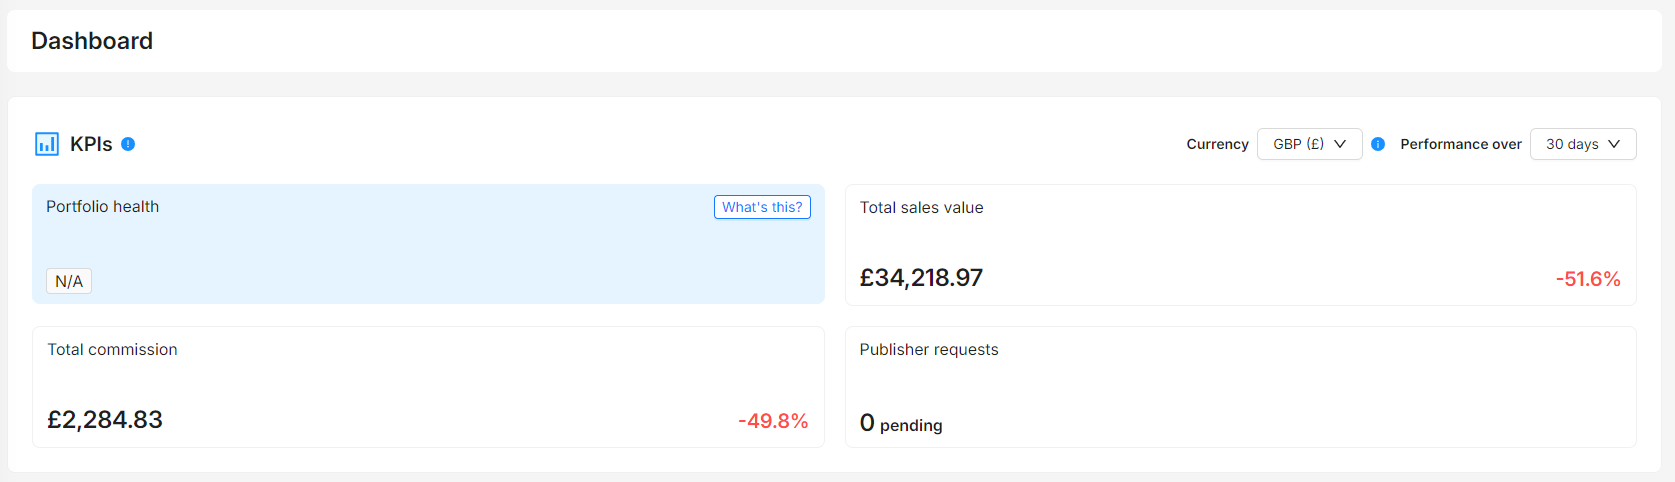
The KPIs sections shows the key performance data for your portfolio of programs
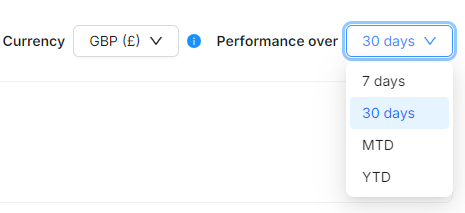
You can select the desired currency, and the timeframe you wish to view the performance over. The default will be set as the last 30 days.
Total sales value and commission are calculated in the chosen currency, though the individual programs are shown in the currency in which they invoice.
The percentage change show the difference between the current period and the previous period.
For example, if the date range is set to 7 days, then the previous period will be from 14 days ago to 7 days ago.
For MTD (Month to-date) this will be the total for the current calendar month versus the previous calendar month.
YTD (Year-to-date) will show the total for the current year up to today versus the same period last year.
The data in the report is refreshed every hour.
Publisher requests
From the dashboard, you can accept and reject Publisher requests across multiple programs simultaneously.
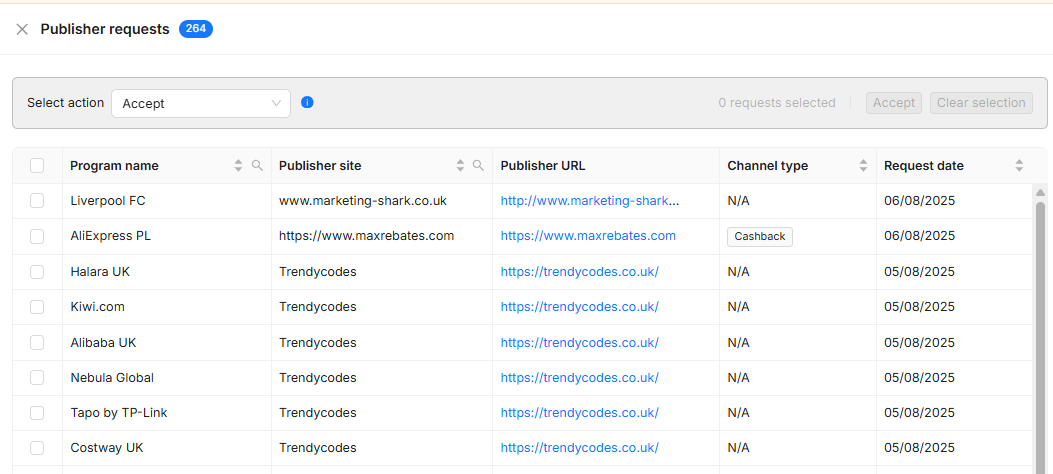
With the filters on Program name and Publisher site you can focus on specific Programs, bulk accept/reject requests from particular Publishers.
Program and Portfolio Health
Every program has a health score, which is calculated based on a number of different metrics
Portfolio Health is the average health of all programs in your portfolio, and displays a ‘Health Score’ based on a number of key performance indicators.
The rankings are defined as follows:
-
New - The program is less than 90 days old.
-
Great - The program has no issues that affect its performance.
-
Good - The program has minor issues that stop it from being a top performer.
-
Fair - The program has a number of issues that need to be addressed.
-
Poor - The program is a low performer and requires action.
-
Bad - The program is receiving very low transactions, and may have a tracking issue.
The score is calculated based on a number of factors, including days since last transaction, campaign memberships growth & activity, pending transaction enquiries, offers and vouchers uploaded to the program, tenancies, and monthly & yearly transaction comparisons.
Programs Overview Table
Here you will find an overview table of each program in your current portfolio, each with a Health Rank and several columns displaying key performance metrics.

-
Health Rank, as outlined here, for each program
-
Program name (searchable)
-
Status - according to the current status of the program (i.e. Live, Setup Incomplete, Suspended, Notice of Closure and Closure in Progress)
-
Closed programs will be excluded from this table
-
-
Days since transaction - days since the last cookie tracked transaction (i.e. this does not include manual uploads and transaction enquiries)
-
Product feed - this will display which programs provide a feed, and if any of those currently have Errors in processing
-
Clicks - Number of clicks recorded in the current period
-
Sales value - shown in the program’s invoiced currency
-
Cancellation rate - this is calculated based on the number of cancelled transactions in the last 90 days
-
Codes and offers - total number of Voucher codes and offers uploaded to the program
-
Publishers
-
Publisher Count - click active publishers in the last 30 days
-
Pending - pending program join request approval
-
Channel mix - number of different publisher Channels that have joined on the program
-
Invited - The number of publishers that have been invited to the program, but have not accepted
-
New publishers - in the last 30 days
-
-
Transactions
Manage Columns
As part of the program overview table, you can Manage Columns to display the data that is most important for you and your portfolio management. Simply click the ‘Manage Columns’ button, which will bring up the sidebar for you to toggle which columns to display.
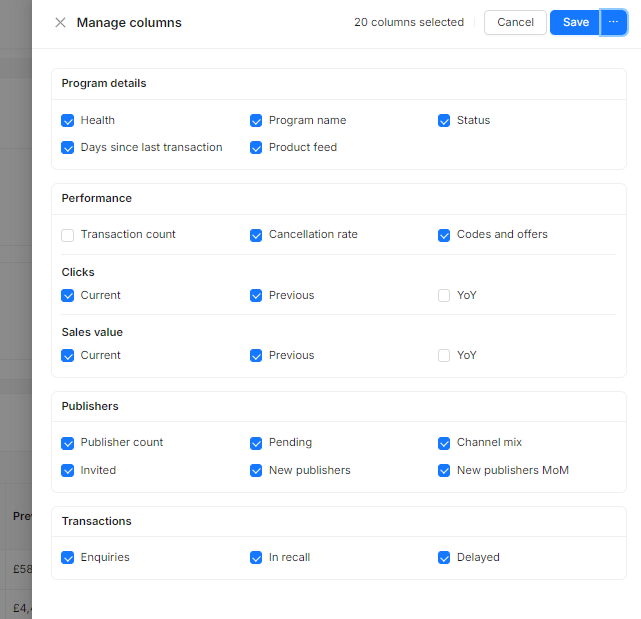
Be sure to Save changes, or Save as the new default.
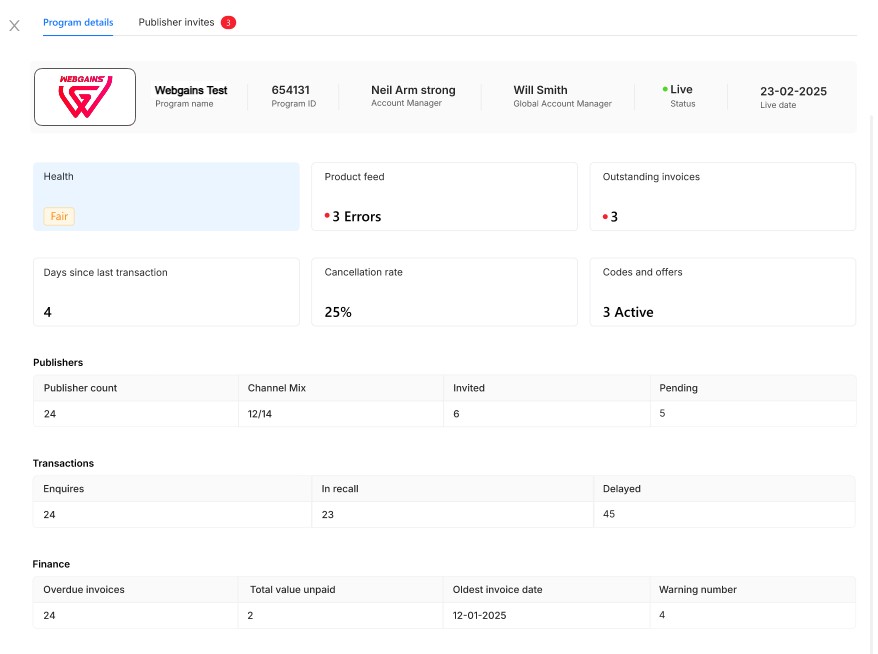
Program Details
If you click onto any program name, a sidebar will display providing a more in depth look at that specific program. This includes details from the table, as well as other metrics like Cancellation Rate, Publishers overview, Transactions overview, and a Finance overview.
Clicking onto the next tab, ‘Publisher Invites’ will display current pending requests from publishes to join the program.
Here you can use the tick boxes and bulk select requests to Accept or Reject accordingly.
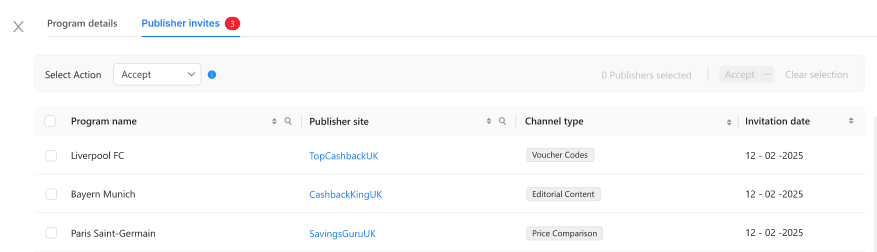
To manage publisher memberships further, please log into the program and navigate to Publisher Management.