Webgains Advertiser Performance Reporting Suite
Tracking your campaigns just got a whole lot easier.
Our new Performance Reporting Suite empowers advertisers to make faster, more informed decisions by providing real-time, actionable insights with faster data refresh rates to ensure the most up-to-date information is displayed. This means our advertisers can best optimise campaigns and adapt quickly to changes.
The new Reporting Suite enables users to view new data visualisations, tables, and comparisons like never before. User-friendly charts and graphs provide clear, at-a-glance insights, making it simple to identify trends and take immediate action. Dive deeper with transaction-level details to understand exactly what’s driving results—from specific campaigns and publishers to individual products. Use interactive charts and data tables to filter and explore your data by campaign, publisher channel type, or commission scheme, giving you the flexibility to uncover new opportunities and maximise ROI.
Below is an overview of what our new Performance Reports have to offer, and how you can use them to elevate your reporting on your Webgains program.
Overview
The Performance report is made up of 6 tabs – the main Performance report which provides charts breaking down performance by publisher, channels, countries, commission, ads and products.
The Details tab provides the details on each transaction and the products within each transaction.
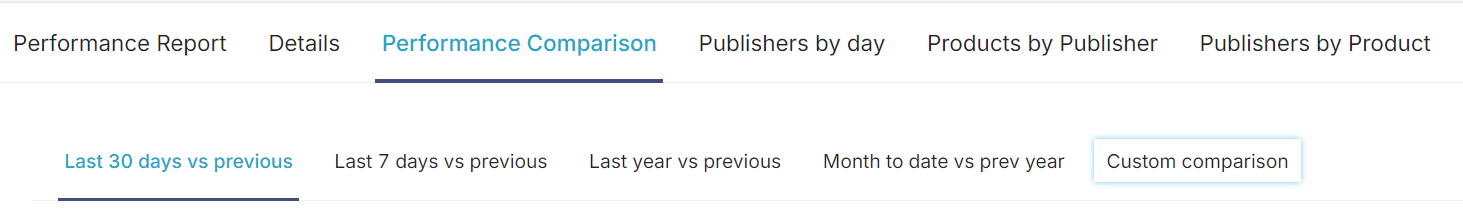
Then, there are a few different Comparison tabs. The Performance Comparison page provides comparisons between the current month, this week vs last week, year on year, the current month vs the same month last year, and custom comparisons.
Following this are Publishers by day, Products by Publisher, and Publishers by Product. Each allows an in depth comparison for each metric.
Performance Report Tab
This page provides a range of different tables and charts covering different dimensions of a program/s performance. As with other pages on the advertiser platform, you’re able to report on one or multiple programs combined in these reports (using the program dropdown in the top nav).
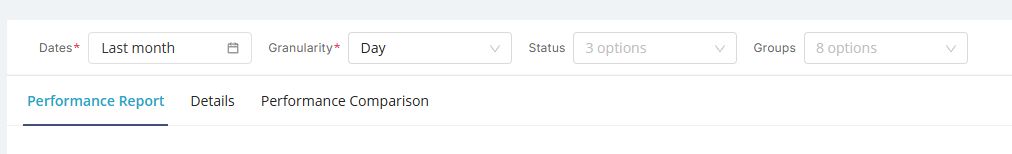
Filtering
At the top of the page are the filters which are used to determine the range of transactions and clicks the reports are applied to. By default, the dates will be set to the show data for the current month to date. The granularity of the data can be set between a day and a calendar year.
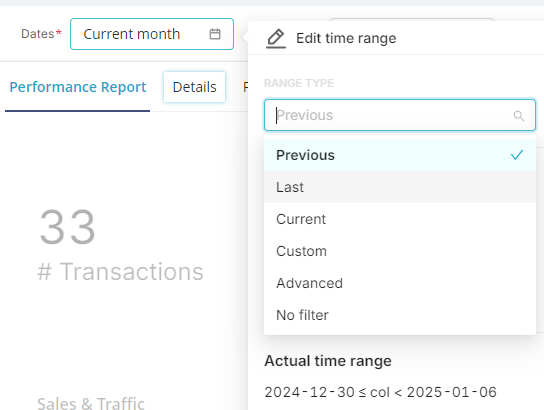
You can Edit the time range and select ‘Previous’, ‘Last’, and ‘Current’ to view standard timeframes. (For example, ‘Last’ month). Or, select Custom to add the specific dates you would like to report on.
The time range will be displayed after your selection.
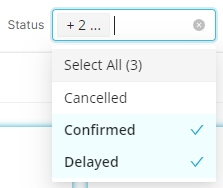
The status is the status of the transactions is another filter that can be used. By default these are all the Confirmed and Delayed transactions. Cancelled transactions are excluded by default but can also be enabled.
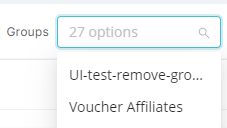
The Groups enable you to filter by the program’s custom Publisher Groups.
Publisher Groups can be set up within a program to allow for custom groups that an advertiser may wish to filter reporting by.
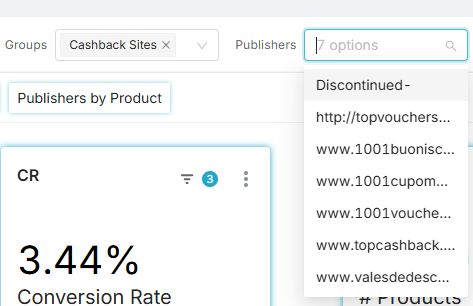
If you have already selected the Groups filter, then the Publisher filter will update to reflect the publishers added in the selected groups.
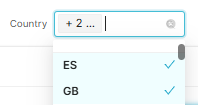
You can also filter by Transaction Country. This reflects the tracked country for the transaction.
All of these filters apply across the Performance Report and Details tab. However, only the Groups and Status are available and apply filters on the Performance Comparison.
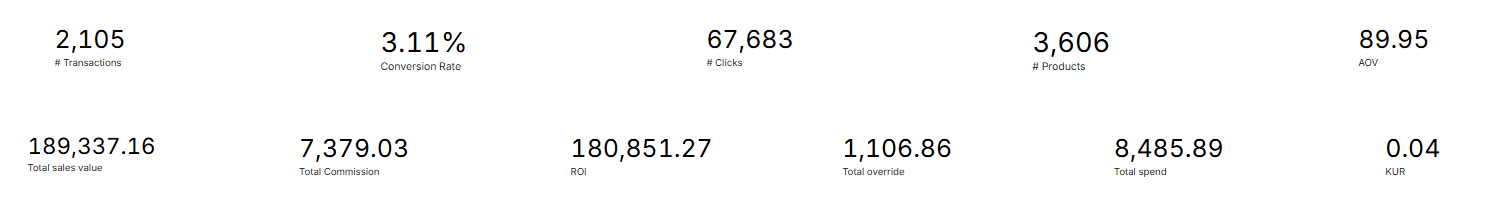
KPIS
At the top of the page you will find a selection of KPIs to view.
-
KUR (Key Unit Revenue) calculation: (Commission + Override + Tenancy, [if applicable]) / revenue
-
ROI (Return on Investment) calculation: profit divided by the total cost
-
View more in: Affiliate Marketing Terminology Glossary
Charts
On the Performance Reports page, you’ll find these charts:
|
Metric |
Description |
|---|---|
|
Sales & Clicks |
This chart visualises the performance of the selected programs over the date range and the granularity defined in the date range. |
|
Performance |
The performance table gives you more insight into each day, week, and month within this series, including the number of transactions, product sales, conversion rate, basket value, and ROI (Return on investment). Conversion is calculated as the ratio of transactions to clicks. |
|
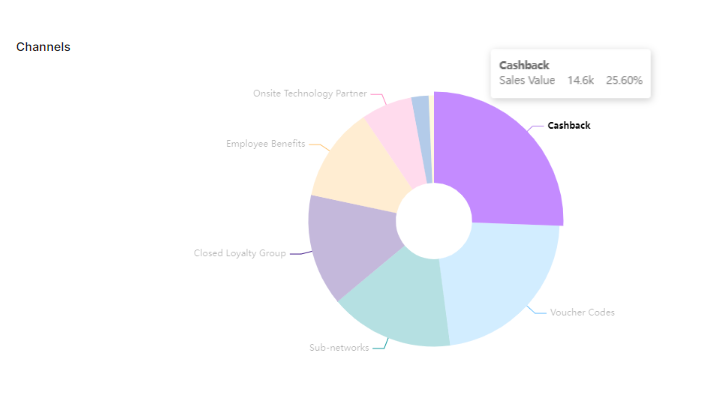
Publishers and Channels |
These charts show the relative performance of the publishers and their Channel types within your programs. The Publishers table shows the top-performing publishers, but you can also search for any publisher in a program. |
|
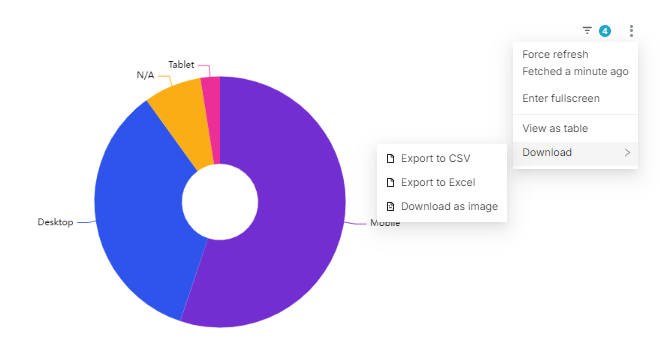
Devices |
A breakdown of device types used by customers for the transactions between desktop mobile and tablet. This information can’t be collected for all transactions, so in this instance, the device type will be shown as N/A |
|
Commission |
The commission table shows the performance of each of your commission schemes, the commission rate and whether they’re Event or Smart commissions. You’ll also see any Tenancies and Transaction Enquiries shown here. |
|
Voucher codes |
You can see the value of sales and commission attached to each voucher code used. As with Publishers, this table can also be searched. |
|
Ads and ads type |
Shows the sales and commission attributed to text and graphic ads as well as items from your product feed. (Note, standard ‘tracking link’ tracked sales will appear as ‘Text’ in the Ads table). |
|
Products |
The product table shows the best-performing products within your program |
Using the Charts to filter the Performance Report
Each of these panels enables you to filter the whole of the report based on a specific dimension. On the performance table, for example, clicking on a single row will filter the data to cover just that date.

Clicking on a segment of a pie chart will filter the page to just that data segment.
These filters are then shown at the top of the page and can be removed by clicking the x next to them
Downloading Data
The data from each of the table or chart can also be viewed as a table, or downloaded by clicking on the 3 dots in the top right of each panel:
Details Tab
On the Details tab, you can see a detailed breakdown of transactions based on the selected date range. For each transaction, you can see info about the ad, the campaign and the publisher that the transaction is attributed to.
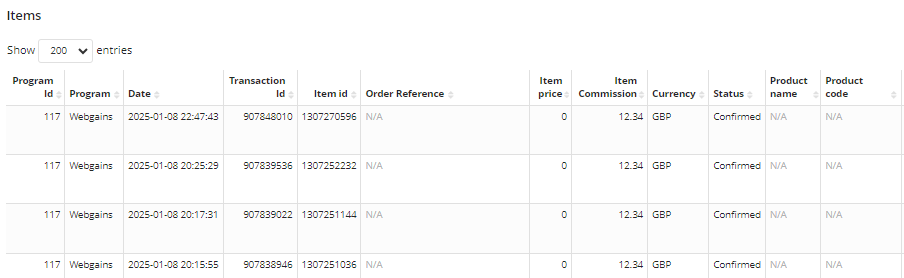
The items table enables you to dive even deeper into each transaction breaking down each transaction into the items/products within it and showing more info on the commission scheme and any voucher codes that have been applied.
Both the transactions and the items table can be searched to find specific records, even if they don’t appear in the list (as the list is limited), allowing you to search by order reference, and campaign name if the transaction appears as part of that filtered view.
Comparison Tab
The comparisons tab provides a range of fixed comparisons for different date ranges - the month to date vs the previous month, week to date vs last week, year to date vs last year and current month vs the same month last year. In addition, users can set custom date ranges depending on the periods they wish to compare. See below for further guidance on this.
The report shows the Sales, Clicks and Commission values for these comparisons as well as the top Publishers and channels and their change over the compared periods.
Red denotes a downward trend and Green an upward trend.
Creating a Custom Comparison
On the Custom comparison sub-tab, you can create performance comparisons for against a comparison period in the past.
Firstly the date range of the current or most recent period and then set the Comparison Start Day to the first day of the period in the past you want to compare to.
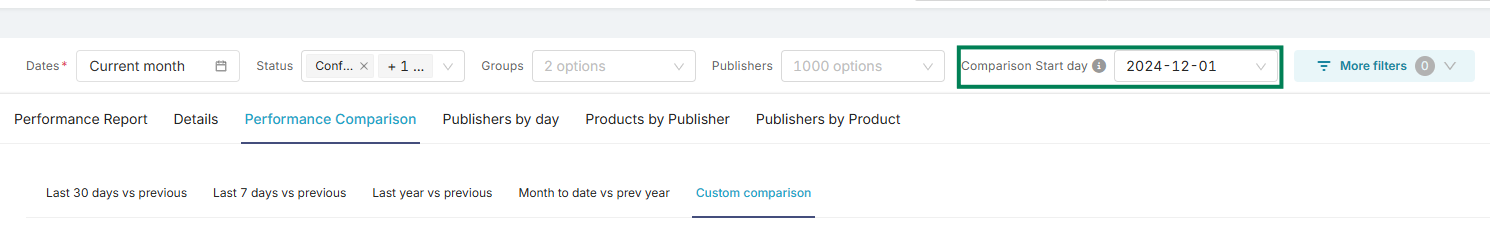
For example, if you want to compare the performance of December 2024 with December 2023:
-
You would set the Dates to a Custom range with a Specific Date/Time of 2024-12-01 to 2025-01-01
-
Then set the Comparison Start Day to 2023-12-01 and click Apply.
-
When you select Apply this will compare the currently selected period (e.g. the current month) to the same duration in the past starting from the Comparison Start Day.
Here’s a quick video demonstration:
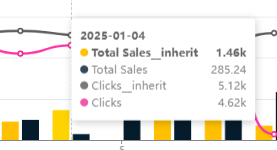
To note, when checking the custom comparison graph, the black bar will show the current date/time period, and the yellow bar will show the compared period. For the report labelling, “inherit” will refer to the compared period.
Publishers Performance by Day

This report shows how each publisher has performed each day over a particular period. You can expand out each Publisher to see their performance.
Products by Publisher and Publishers by Product
These two reports enable you to get more detail on how each publisher contributes to sales of particular products. This can viewed grouped by Publisher or by the products themselves
Timezones
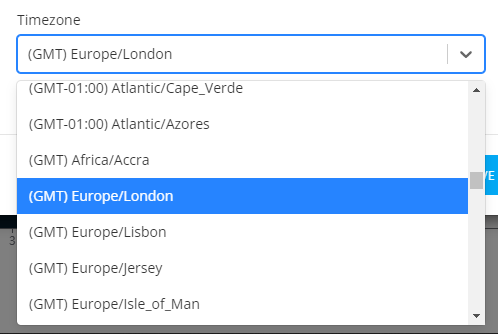
The new Performance Reports currently summarise each day based on UTC (GTM-0) time, while the older Webgains reports (Activity, Transaction) adjust the timezone based on your user settings. This means if you’re based outside of the UK in a different timezone, you’ll currently see some small differences between the new reports and the dashboard and activity report. For a direct comparison, you can change your timezone in the user settings in the top right.
Currencies
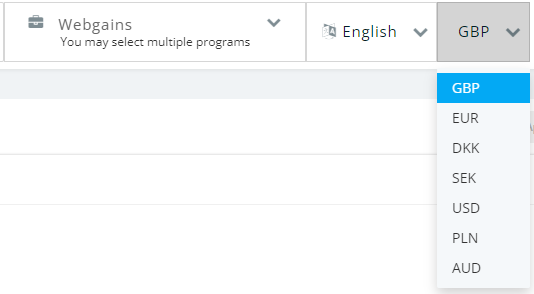
The currencies for the report are defined by the currency shown in the top right and will adjust the figures based on the currency selected. Where multiple programs are selected the report will show all figures in a single currency and not the base currency of that program.
Other FAQs
Q: Why does the Product Performance Charts show data, even though I do not have product level tracking setup for my program?
A: If a program does not track products through their Webgains transactions, the sale itself will still count as an ‘item’ within the reporting. This is to ensure that we do not have discrepancies between the data. The ‘Details’ tab will count 1 Product per transaction, but if you expand further into the transaction details you should notice the product fields show data as N/A.
Q: What happened to the old performance reports?
A: The old performance reports have been retired and are no longer accessible through the platform. If you need access to data from the old reports, please contact support@webgains.com.
Q: How do I access my scheduled performance reports?
A: Any previous Scheduled Reports that you had set up will still exist in the ‘My Reports’ page of the advertiser platform, where you can continue to edit and receive your existing scheduled reports.
It will currently not be possible to create new scheduled reports from the new Performance Report suite.
Q: What if I see ‘Unverified’ for a Publisher Channel type?
A: In some cases, if a Publisher has not set their Channel Type, you may see it displayed as 'Unverified' within the report pages. This just means that the publisher has not been categorised yet. If you require any assistance with a specific publisher please reach out to publisherteam@webgains.com.
Q: How is ROI calculated?
A: Return on Investment (ROI) is a measure of the profitability of an affiliate marketing campaign, calculated as profit divided by the total cost.