Skip table of contents

Introducing Webgains Customer Journey Report

vouchIntroducing the new Webgains Customer Journey Report!

What is it?

The new Webgains Customer Journey Report provides greater insight into the customer behaviour that leads to a transaction. By tracking all of the touchpoints in a customer journey, the report allows advertisers to analyse exactly which Channel Types and Publisher Sites their customers are interacting with leading up to a purchase.

Across all pages in the report, we are only reporting on transactions with a tracked journey (aside from the Transactions tab which includes 0-touchpoint sales), where touchpoints have been generated using the Webgains Resilient Tracking Suite, so any touchpoints that fall outside of this and or the attribution window may not be included in the data. This may exclude some transactions where there are no touchpoints to track, such as Transaction Enquiries, Manually Uploaded Transactions, or a Voucher tracked sale. For this reason, figures may differ from other transaction/performance reports.

The Customer Journey Report includes 3 tabs:

image-20250507-120643.png

Within each tab, use the Date Picker to select the timeframe you wish to view the customer journey data for. By default, the dates will be set to show data for the last 30 days. You can Edit the time range and select ‘Previous’, ‘Last’, and ‘Current’ to view standard timeframes. (For example, ‘Last’ month). Or, select Custom to add the specific dates you would like to report on.

image-20250425-132653.png

Publisher Channels & Overview

KPIs

image-20250425-110900.png

The Publisher Channels & Overview tab will feature 4 KPIs:

  • Average Days from 1st Touchpoint to Purchase

  • Average Days from Last Touchpoint to Purchase

  • Max Touchpoints Found

  • Average Touchpoints per Transaction

A ‘touchpoint’ refers to a customer action within the purchase journey. Typically this will be a Click, or a View/Impression (if your program is set-up for this).

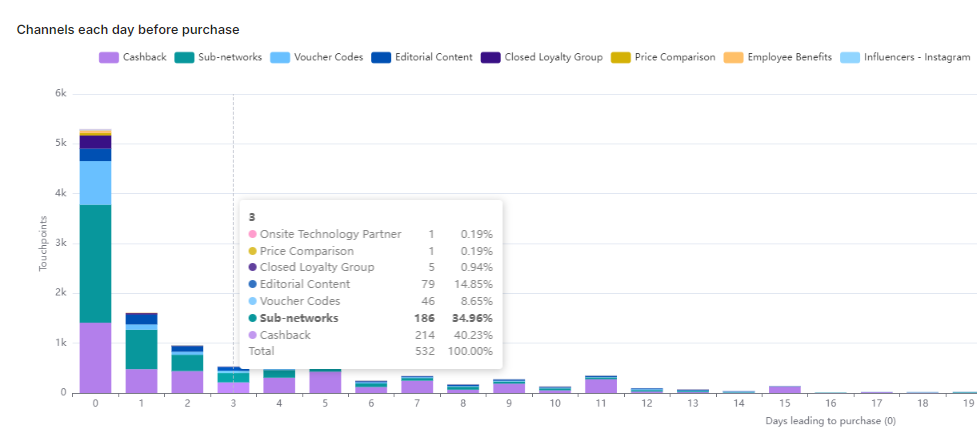
Channel Distribution per day before Purchase

This graph demonstrates the distribution of channels that generated touchpoints in the customer journey before a purchase was made.
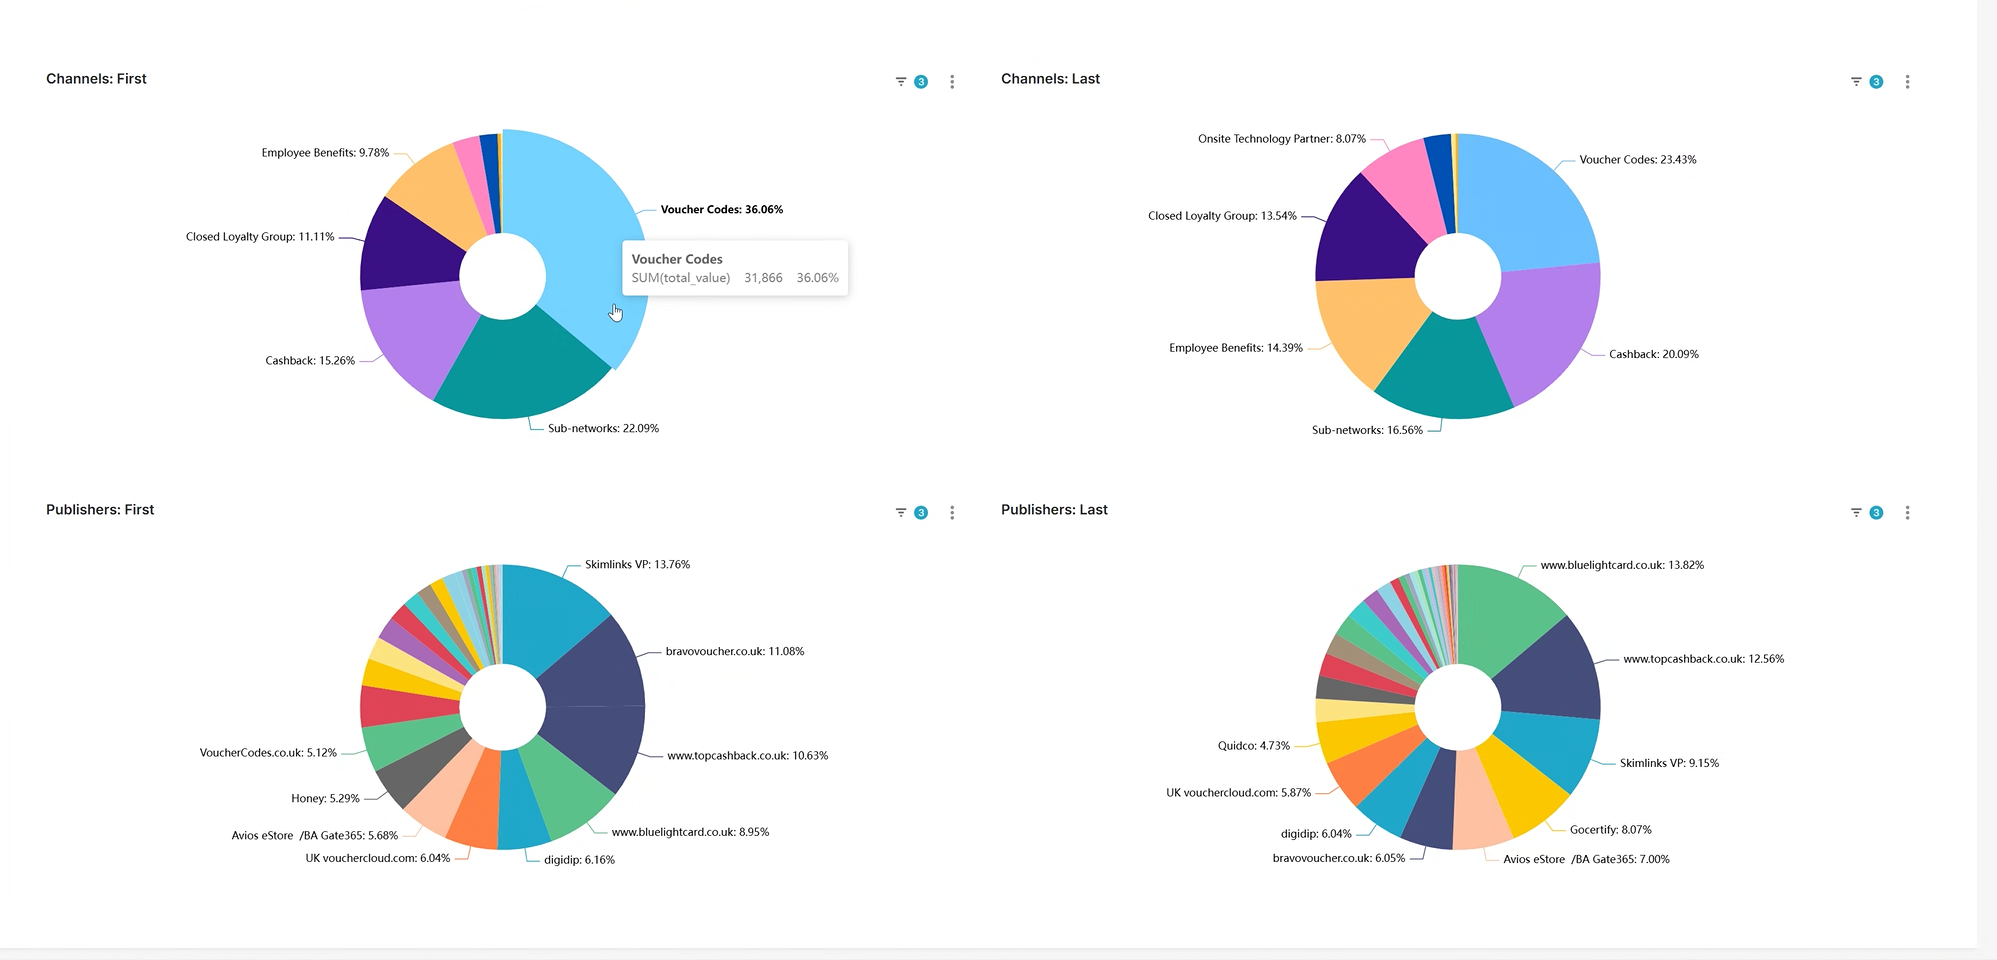
 The X-axis shows the Days before the Purchase (here we will show as far back as the date of the first click), and the Y-axis shows the number of Touchpoints that have been generated. You can then hover over the bars to view the distribution of the touchpoints by each publisher channel.

For example, we could look at the below chart and infer that (for the specified date range) 3 days before a customer purchase, Sub-Network publishers generated the most touchpoints (357), with 32.37% share.

image-20250519-094550.png

Attribution will still be calculated based on your program cookie period (e.g. 30 days), even if we have tracked touchpoints from further in the past (e.g. 90 days).

Channels & Publishers: First vs Last Click - Sankey Diagrams

Within this section you will find 2 Sankey diagrams displaying the flow from First to Last Click in customer purchase journeys, for each of Publisher Channels and Individual Publishers.

You can examine the journeys between First Click and Last Click (Attributed click) for each Channel Type/Publisher, and see the proportion of sales which start and end with the same channel type/publisher (both first click and last click are the same colour), and view cases where the customer journeys starts with one channel type/publisher and ends with another.

This may be useful for advertisers looking at which publishers to invest in, as we can see where the customer started, and where they ended up clicking right before making the purchase.

These charts can be filtered by the Sliding Scales at the top of the report page to display how many elements you wish to view. The default is 10, minimum is 5, and maximum is 15.

image-20250425-140605.png

For easier viewing, you can also click and drag the entities in the Sankey diagram to clearly see the path.

When you hover over each section, the Total Sales Value will be displayed, representing the value generated by the touchpoints in your current selection.

image-20250515-102536.png

‘OTHER’ will represent any Channel Type/Publisher outside of the current filter scope. So, if you have filtered on the sliding scale to 5 elements, 4 Channels/Publishers will show and all others will be grouped into the ‘OTHER' element.

Example Journey
merged_with_borders-20250515-112821.png

In this example we can firstly see that there is a total value of £13.9k where a Voucher Code publisher was the first click in a transaction.

Then, some of these branch off to a Last Click by a Cashback publisher. We can see that £5k of the Voucher Code first clicks are then being converted by a Cashback publisher, with Cashback publishers overall converting £40k in sales value.

image-20250515-103539.png

Hover over the large black bar to view the Total Sales Value for the period across Channel Types.

Please note that the Total Sales Value for the last click and all of the purchases includes customer journeys with 0 touchpoints (e.g. manually uploaded transactions) and 1 touchpoint (e.g. where we only have a first click and no last click)

Donut Charts - First & Last Click

We also include Donut Charts to view a direct comparison between the First and Last Clicks between Channels and Publishers.

The segment size represents the % share of the First/Last Click.

The SUM(total_value) represents the sum of all transaction values where the first click was created by that Channel/Publisher. (In the example below, 31.8k value was generated by a Voucher Code 1st Click).

The % value represents the percentage of all transactions where that Channel/Publisher was the 1st Click. (In the example below, 36% of all transactions had Voucher Code channel as 1st click).

image-20250513-142932.png

Transactions > Customer Journey

The Transactions table provides an overview of transactions generated within the selected date range, and if you then click on a Transaction ID from the 1st table, the 2nd table (Customer Journey per Transaction) will update to display a breakdown of the touchpoints for that transaction.

image.jpg

The first listed rows will show the higher steps - these are the first touchpoints in the customer journey. Each subsequent touchpoint will then be listed, displaying the time between each touchpoint and which publisher generated it, until we reach the final touchpoint from the publisher that was attributed the sale. Step 0 will represent the Last Click, with the Highest Step representing the First Click in the customer journey.

image-20250425-113747.png

This allows advertisers to analyse the customer journey for specific transactions, such as checking those with the highest sales values to see what led the customer to the point of purchase.

If a program is set up on Post View attribution, you will see ‘View’ listed as the Type when inspecting the transaction, like below:

image-20250515-103248.png

`

Across all pages in the report, please remember we are only reporting on transactions with a tracked journey. For this reason, figures may differ from other transaction/performance reports.

If you notice a transaction with 0 touchpoints, this could be for a few reasons. Most commonly, it might be that the transaction was manually uploaded (e.g. via batch upload, or transaction enquiries), meaning that there are no touchpoints in the journey. Other reasons include:

  • API tracked sale.

  • Voucher Commission (as the transaction is attributed based on the specific voucher code used in the sale).

  • Occasionally, missing data.

Transactions with just 1 touchpoint only have a last click and no first click.

Assisting Publishers

This page helps to identify and analyse the performance of publishers that have assisted (generated touchpoints) in transactions.

Top Assisting Publishers

This table displays a list of top publishers, within the specified date range, that generated touchpoints in transactions.

The ‘Assisted Transactions’ column represents publishers who have generated touchpoints in transactions but were not attributed the sale. That is, they lost the sale to another publisher for the last click.

The ‘Converted Transactions’ column represents publishers who were attributed transactions. That is, they were the last-click before the customer made a purchase and so were awarded the commission.

Also shown in this table are the number of tenancies and total tenancy value for each publisher during the selected period.

image-20250519-094204.png

Publishers with very high ‘Assisted Transactions Value’ but very low converted transactions might be important touchpoints that contribute towards transactions - even if they’re rarely the final click before a purchase.

The publisher may have helped with awareness of your store or a particular product you sell and it could be worth investing in a tenancy or additional exposure with the publisher.

Tenancies during period & Tenancies Scheduled

Tenancies that occurred within the selected date range will display in the Tenancies table, according to what was added within Webgains Tenancy Planner tool. The Tenancies Scheduled table will display Tenancies outside of the date range selection, so that a full record of scheduled and processed tenancies is displayed.

For any completed tenancies, clicks and transactions from the tenancy period will be reported, so that you can compare with the Assisting Publishers table and assess performance of tenancies/additional exposure with publishers.

image-20250520-085745.png

JavaScript errors detected

Please note, these errors can depend on your browser setup.

If this problem persists, please contact our support.